POCUS: Feissel
Respiratory Changes in Aortic Blood Velocity as an Indicator of Fluid Responsiveness in Ventilated Patients With Septic Shock
Feissel. Chest 2001; 119:867-873
Clinical Question
- In patients with septic shock who are mechanically ventilated does indexed LV end-diastolic area or respiratory changes in aortic blood velocity predict the haemodynamic effects of volume expansion?
Design
- Prospective observational diagnostic study
- Presumed convenience sampling (not stated)
- Blinding not stated
- Statistics
- No sample size calculation performed
- Nonparametric Wilcoxon rank sum test used to asses the effects of volume expansion on haemodynamic parameters
- Nonparametric Mann-Whitney test used to compare haemodynamic parameters prior to volume expansion in responder and non-responder patients
- Linear correlations tested using Spearman rank method
Setting
- 2 intensive care units in France (1 university and 1 non-university)
- Dates of data collection not stated
Population
- Inclusion criteria:
- Septic shock (defined by 1992 ACCP/SCCM consensus conference)
- Haemodynamic stability (variation in HR and BP of <10% over the 15 minute period before starting the protocol)
- Exclusion criteria:
- Arrhythmias, PaO2/FiO2 ratio <100mmHg, contraindication to transoesophageal echocardiography (TOE), aortic valvulopathy, LV systolic dysfunction (fractional area of contraction <30%), doppler LV output recordings using transgastric view could not be obtained
- n=19
- All received inotropic and vasopressor drugs
- TOE performed between 12-72 hours after diagnosis of septic shock
- All had already received colloids (3±2 L) and/or crystalloids (1±1 L)
Tests of Interest
- LV end-diastolic area index (EDAI)
- TOE used to obtain a transgastric, short-axis, cross-sectional view of the LV at the mid-papillary muscle level
- End-diastole defined as the frame corresponding to the largest LV cross-sectional area immediately after the R-wave peak on the ECG
- The anterolateral + posteromedial papillary muscles were included within the ventricular area
- LV areas divided by body surface area (BSA) to obtain EDAI
- Used mean of 5 measurements performed at the end of expiration
- Respiratory changes in aortic blood velocity
- Aortic blood flow measured over single respiratory cycle to allow measurement of peak velocity (Vpeak) and determination of maximum Vpeak values (Vpeakmax) and minimum Vpeak values (Vpeakmin)
- Change in peak velocity (ΔVpeak %) = [100 * [Vpeakmax – Vpeakmin]] / [[Vpeakmax + Vpeakmin]/2]
- Mean value of 5 determination used for statistical analysis
Gold standard investigation
- Cardiac output measurement
- Using TOE, LV outflow tract and ascending aorta imaged when parallel to the ultrasound beam
- Aortic blood flow measured by pulse wave-doppler at level of aortic valve
- Diameter of aortic orifice measured at the insertion of the aortic cusp
- Aortic valve area = π * (aortic diameter/2)
- Stroke volume = aortic valve area * the velocity time integral of aortic blood flow
- Cardiac output = stroke volume * heart rate
- Stroke volume and Cardiac output were divided by the BSA to obtain the stroke volume index and cardiac index
- If cardiac index increased by ≥15% with fluid challenge classified as responder. If <15% classified as non-responder.
- Mean of 5 measurements performed at end of expiration used for statistical analysis
All patients
- Mechanically ventilated in volume-controlled mode with tidal volumes of 8-10ml/kg
- Paralysed if significant inspiratory effort detected on visual inspection of airway pressure curve
- Measurements performed prior to volume expansion, then repeated immediately post volume expansion (8ml/kg of 6% hydroxyethylstarch over 30 minutes)
- Ventilatory settings and dosages of inotropic and vasopressor drugs held constant
Intra-observer and inter-observer variability
- Determined in 10 randomised patients
- Mean % error for measurements of EDAI and cardiac output were 6±3% and 8±4% by the same observer and 7±4% and 9±5% between 2 different observers
Outcome
- Primary outcome: Not defined
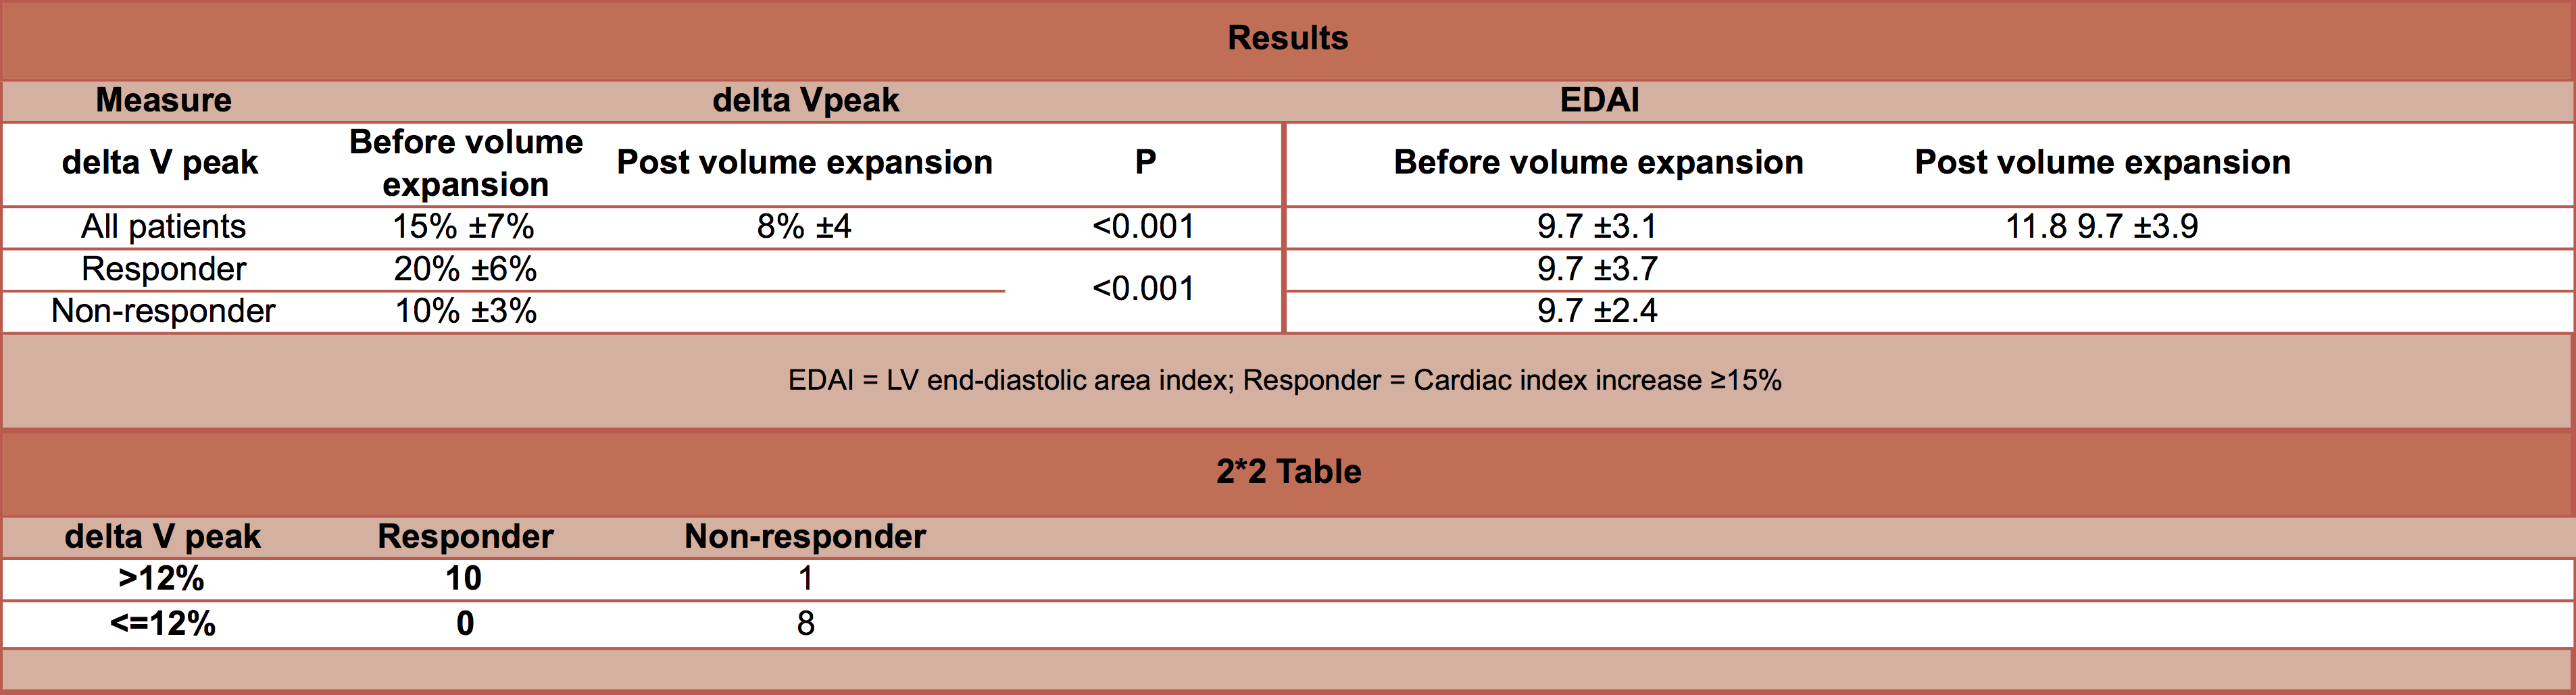
- EDAI
- Before volume expansion
- No significant difference between responders vs. non-responders
- 9.7±3.7 vs. 9.7±2.4 cm2/m2
- No significant difference between responders vs. non-responders
- Volume expansion led to a significant increase in EDAI
- 9.7±3.1 cm2/m2 to 11.8±3.9 cm2/m2
- The increase in EDAI significantly correlated with the % increase in Cardiac index (r2 = 0.49, P<0.01) such that the greater the increase in EDAI, the higher the increase in cardiac index in response to volume expansion
- Before volume expansion
- ΔVpeak
- Before volume expansion
- Significantly higher in responder vs. non-responder
- 20±6% vs. 10±3%, P <0.001
- Using threshold for ΔVpeak of 12%, gave a sensitivity of 100% (95% C.I. 69-100) and specificity of 89% (95% C.I. 52-100) for discriminating between responder and non-responder
- >12% in all 10 out of 10 responders
- ≤ 12% in 8 out of 9 non-responders
- Significantly higher in responder vs. non-responder
- Volume expansion led to a significant decrease in ΔVpeak
- 15±7% to 8±4%, P<0.001
- A positive linear correlation found between ΔVpeak before volume expansion and volume expansion-induced changes in cardiac index (r2 = 0.83, P <0.001) i.e. the higher the ΔVpeak before volume expansion, the greater the increase in cardiac index in response to fluid challenge
- Before volume expansion
Authors’ Conclusions
- In patients with septic shock analysis of respiratory changes in aortic blood velocity is an accurate method for assessing fluid responsiveness
Strengths
- Clearly defined test of interest and gold standard investigations
- Tested for inter and intra-observer variability
- Controlled known confounding variables
Weaknesses
- No sample size calculation
- Presumed convenience sample
- Did not state who performed TOE and what training they had received
- Aortic blood velocity used in test of interest and for gold standard investigation
- Small sample size led to wide confidence intervals for sensitivity and specificity
The Bottom Line
- In this small study, patients with septic shock who were mechanically ventilated with tidal volumes of 8-10ml/kg, the respiratory changes in peak aortic blood velocity predicted which patients would have a significant increase in cardiac index with a fluid challenge. The increase in LV end-diastolic area index with a fluid challenge significantly correlated with the increase in cardiac index; where as the baseline LV end-diastolic area index did not predict if a patient would be fluid responsive.
External Links
- [Free full text] Respiratory changes in aortic blood velocity as an indicator of fluid responsiveness in ventilated patients with septic shock
- [further reading] Life in the Fast Lane: Fluid responsiveness
- [Further reading] ICU Sonography: Tutorial 4 – Volume status and preload responsiveness assessment
- [Further reading] Marik: Echocardiographic Assessment of Preload Responsiveness in Critically Ill Patients
- [Further watching] Ultrasound Podcast: Echo, echo, echo
Metadata
Summary author: David Slessor
Summary date: 7th December 2015
Peer-review editor: Duncan Chambler