Bayesian Statistics
 Bayesian Statistics
“Under Bayes’ Theorem, no theory is perfect. Rather it is a work in progress, always subject to refinement and further testing” Nate Silver
Introduction
With the recent publication of the REMAP-CAP steroid arm and the Bayesian post-hoc re-analysis of the EOLIA trial, it appears Bayesian statistics are appearing more frequently in critical care trials.
The purpose of this is to try and simply explain what Bayesian statistics are and how one can interpret these trials (Disclaimer: I am not a statistician). This is by no means an easy task.
I imagine a lot of people have already encountered a simple application of Bayes’ Theorem without realising it. The Fagan Nomogram was designed to give a post-test probability based on the pre-test probability and the likelihood ratio of the test being conducted.
This takes the pre-test probability and combines it with the likelihood ratio (LR) of the test to get a post test probability. This can be conducted with the LR+ (Sensitivity/1-Specificity), which is used for positive test results or the LR- for negative test results (1 – Sensitivity/Specificity).
Bayes’ Theorem
Before moving onto Bayesian statistics, Bayes’ Theorem should first be defined. The Encyclopedia Britannica describes it as a means for “revising predictions in light of relevant evidence”. More simply, it is the formulation of a new or posterior belief from the combination of prior beliefs and new data gathered. The Fagan Nomogram applies this principle with the combination of a pre test probability and the likelihood ratio of a test (new data) to form a new revised prediction.
This can also be pictorially represented – the graph below shows the new posterior belief for a certain treatment has a reduced relative risk when the prior belief is combined with the data collected.
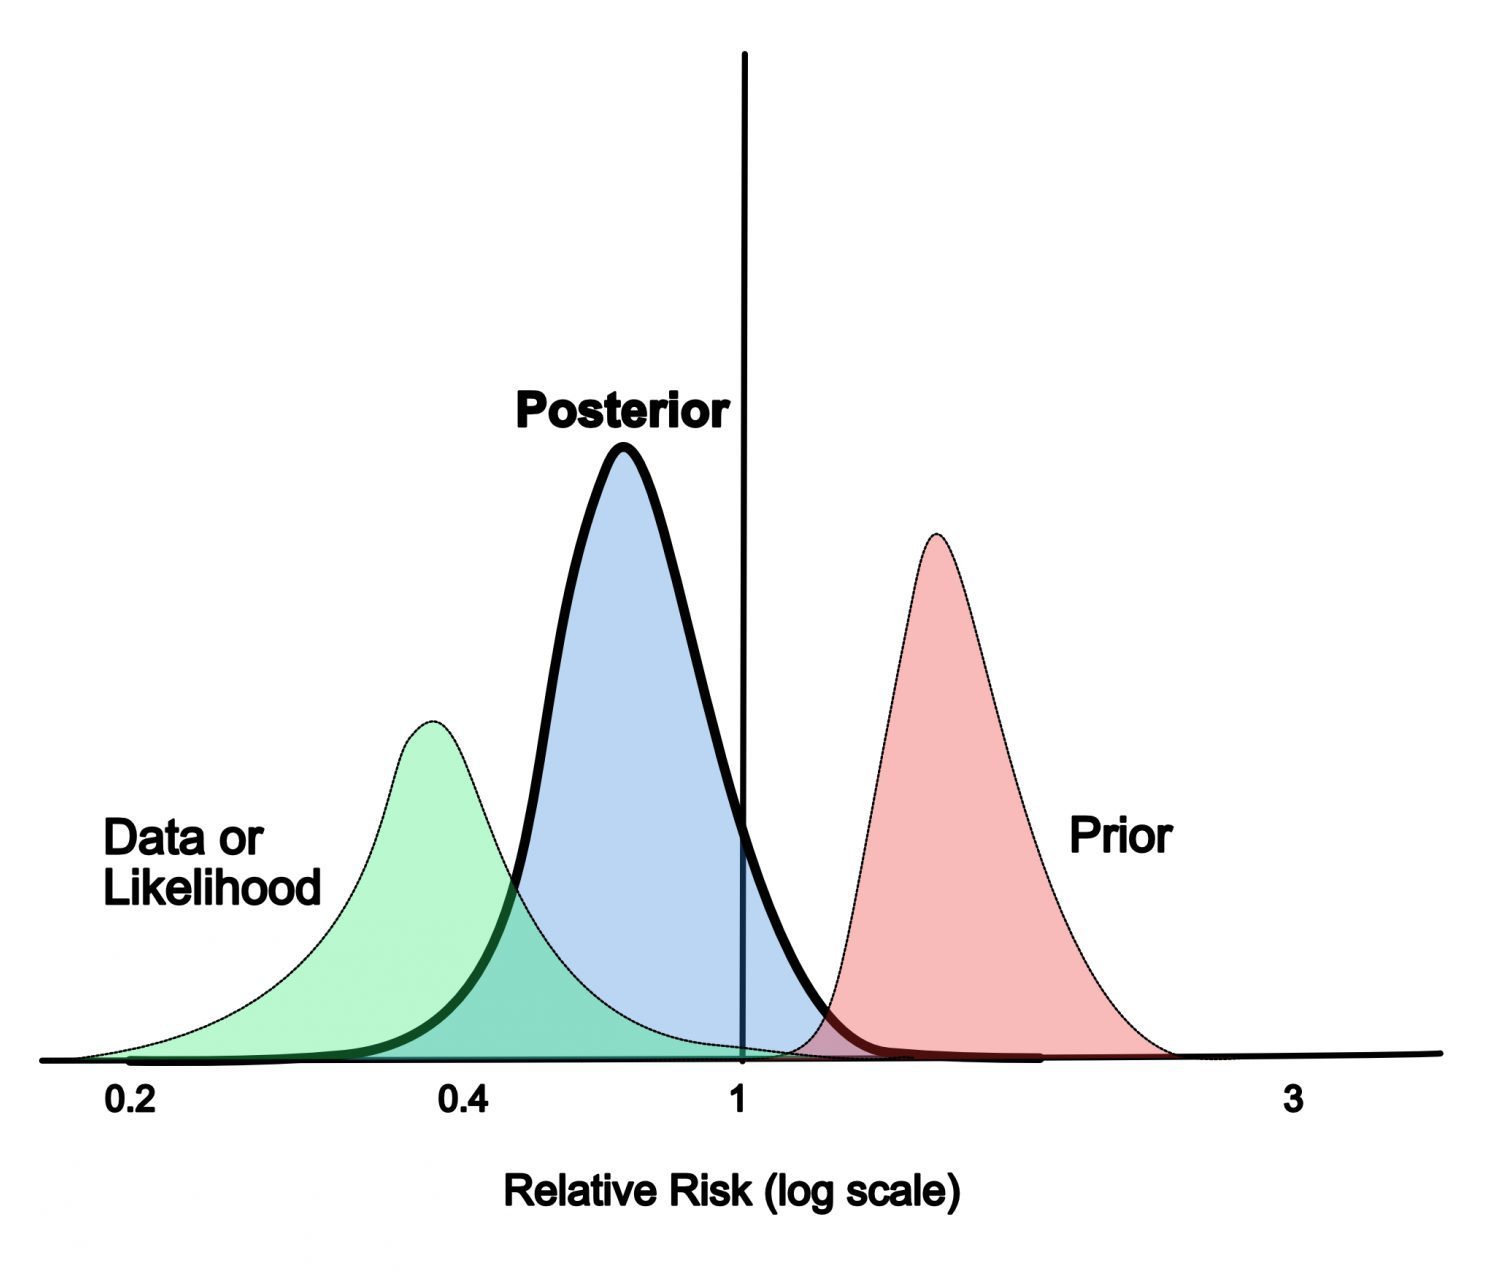
Personally, I like the explanation given by Daniel Kahneman in Thinking, Fast and Slow. Here he describes that “Bayes’ rule specifies how prior beliefs should be combined with the diagnosticity of the evidence, the degree with which it favours the hypothesis over the alternative“.
Bayes’ Theorem is defined by the following formula:
P (A/B) = [P (B/A).P(A)] / P(B)
whereby:
- P (A/B) is the probability of observing A if B is true. This is the new posterior belief.
- P (B/A) is the probability of observing B if A is true. This is also known as the likelihood.
- P (A) is the prior, or the probability of the hypothesis being true prior to collecting the data
- P(B) is the marginal and the probability of collecting this data under all possible hypotheses
Before considering how Bayesian statistics can be applied to clinical trials, here is a worked example of Bayes’ Theorem.
This is a non-clinical example:
“A driver was tested on New Years Eve. From previous studies you know that at this time of year 15% of drivers stopped are drunk. A breathalyser identified the driver as drunk. Testing has show this to be correct at the roadside only 80% of the time and incorrect 20% of the time. What is the probability that the a driver tested positive was actually drunk?
(A) is that the driver is drunk, and (B) is that the driver is identified as drunk when tested
We know that 85% of drivers are not drunk and 15% are drunk (the prior belief or base rate) therefore the probability of a driver being is drunk is 0.15 [P(A)] and 0.85 for not being drunk.
Unfortunately the police test is 80% (0.8) accurate. In other words, identifying the driver as drunk when they are or [P (B/A)]. So if test results show the driver is drunk (+ve test), the probabilities are now either:
- drunk (0.15) and correct (0.8) = 0.12 (true positives)
- not drunk (0.85) and incorrect (0.2) = 0.17 (false positive)
P (B) is the probability of the driver being identified as drunk by the test, so is a sum of the true positives (0.12) and false positive (0.17), which equals 0.29.
So:
P (A/B) = .12 / .29 = 0.41 or 41%.
This is otherwise known as positive predictive value.
How does this apply to clinical trials using REMAP-CAP as an example?
These are some key areas that should be considered when trying to interpret a Bayesian Trial. REMAP CAP has been used as an example:
Assess the Prior:
- Formulation of a prior distribution should be from all the available information (ideally this is from previous trials / meta analysis but can be from expert opinion).
- A prior distribution is considered informative if it expresses specific, detailed data or information
- If not much data exists then you may have a “lowly informative”, or even “non-informative” prior. In this case, the data gathered in the trial will have the greater impact on the posterior than if you have an informative prior
- The prior must be formed prospectively before data collection as to avoid bias
- The prior should be defined
- A simple classification of priors is enthusiastic, neutral and skeptical
- A skeptical prior is centered that there will be no meaningful response to the intervention, and an enthusiastic prior is centered that the studied intervention will be effective. A neutral prior is in between a
- Thus, when these different priors are combined with a given set of data collected the posterior and probability calculated will be different
- REMAP CAP Prior:
- Defined prospectively and neutral
- Prior based on clinically relevant ICNARC data, which will be highly relevant and contemporaneous to the study group.
- Data and formula for all the priors are given in the statistical analysis appendix
Statistical Analysis:
- From the observed data and the prior probability, a posterior probability is calculated
- Although a lot of these points may be too complex for non statisticians, the publication of statistical methods and analysis is important to help interpret the validity of the results, as well as allowing experts to critique the analysis
- Statistical models, software and settings and algorithms used should be specified.
- Algorithm convergence is important
- This is a complex statistical concept with no single adequate assessment but it is crucial to ensure it has occurred for the model and algorithm used to be valid
- REMAP CAP Analysis
- Statistical models, software and algorithms all specified
- Convergence not obviously explicitly stated in the text, but in the statistical analysis appendix any deviations including non-convergence was being monitored by the statistical analysis committee
Data Presentation and Discussion:
- There should be a summary of the all the data
- Like all statistical measurements the posterior distribution has measures of uncertainty and these should be shown.
- Bayesian statistics use the 95% credible interval (CrI). This indicates there is a 95% probability that the true value lies within this range.
- If different priors (neutral, enthusiastic, or skeptical) are available then the modelling should show the results for when the different priors are used.
- This is important because as noted that a change in the prior will change the posterior
- REMAP CAP Data Presentation:
- Data summarised and presented
- The median adjusted odds ratio was presented with 95% CrI
- Equal tailed percentiles were used – this means the 95% CrI range from the 2.5% percentile to the 97.5% percentile.
- No modelling for different priors shown
- Advantages and disadvantages for a Bayesian analysis discussed
For further reading, Ferreira et al in the BJA have recently published a narrative review on the theory and practical use of Bayesian statistics, in addition to a checklist that can be used to help non statisticians interpret Bayesian Trials.
The EOLIA Trial
The initial EOLIA trial found no 60 day mortality benefit for severe ARDS when compared to conventional invasive mechanical ventilation.
Goligher et al. published a pot-hoc Bayesian analysis of the trial, and concluded that the posterior probability of mortality benefit from early ECMO in very severe ARDS is high.
The team at EM-CRIT have written a comprehensive summary of this reanalysis. This also highlighted some of the weaknesses of a Bayesian approach. As mentioned, the criticism most often laid against Bayesian statistics is that the analysis is explicitly tied to the derived priors. Therefore even if using previous randomised trials (as opposed to subjective expert opinion), if these trials have methodological flaws then the prior may also be flawed.
The Bottom Line
- Bayesian Statistics require a different mindset when trying to appraise critical trials
- Benefits of a Bayesian approach include the provision of a result that can be easily applied into a clinical scenario. Additionally, the use of Bayesian Analyses also negates the need for p-values, which are often misunderstood, and have been concisely summarised here
References
- Kahneman, D. Thinking, Fast and Slow. p 154
- Lee, J and Chu, C. Statistics in Medicine. 2012: 10 (31): Bayesian Clinical Trials in Action
- Ferraira,D et al. British Journal of Anaesthesia. 2020 125 (2): Theory and practical use of Bayesian methods in interpreting clinical trial data: a narrative review
- Ferraira, D et al. British Journal of Anaesthesia. 2010: 125 (2): A consensus checklist to help clinicians interpret clinical trial results analysed by Bayesian methods
- Goligher, E et al. Extracorporeal Membrane Oxygenation for Severe Acute Respiratory Distress Syndrome and Posterior Probability of Mortality Benefit in a Post Hoc Bayesian Analysis of a Randomized Clinical Trial
- Spiegl, R. EM-CRIT 2018. The Case of the Subjective Truth
- REMAP-CAP Investigators. JAMA. 2020: Effect of Hydrocortisone on Mortality and Organ Support in Patients With Severe COVID-19. The REMAP-CAP COVID-19 Corticosteroid Domain Randomized Clinical Trial
Metadata
Summary author: George Walker @hgmwalker89
Summary date: 9th September 2010
Peer-review editor: @davidslessor


Thank you