Type 1 and 2 Errors

Definitions
Null Hypothesis: In a statistical test, the hypothesis that there is no significant difference between specified populations, any observed difference being due to chance
Alternative hypothesis: The hypothesis contrary to the null hypothesis. It is usually taken to be that the observations are not due to chance, i.e. are the result of a real effect (with some amount of chance variation superposed)
Consider Aesop’s Fable about Peter and the wolf:
A boy has the job of protecting a flock of sheep from wolves. If a wolf comes, he is to ring a bell and cry out “wolf”, so that the men from the village will come with their guns. After a few days with no wolf, the boy is getting bored, so he pretends that a wolf is attacking. The null hypothesis is that there is no wolf; the alternative hypothesis is that there is a wolf.
The men come running, and praise the boy even when they find no wolf, believing his story of the wolf having run off. A type 1 or false positive error has occurred.
The boy enjoys the attention, so repeats the trick. This time he is not praised. The men do not believe that there was a wolf. When a wolf really does attack, and the boy rings his bell and cries “wolf”, the men do not come, thinking that he is playing the trick again. The wolf takes one of the fattest sheep. A type 2 or false negative error has occurred
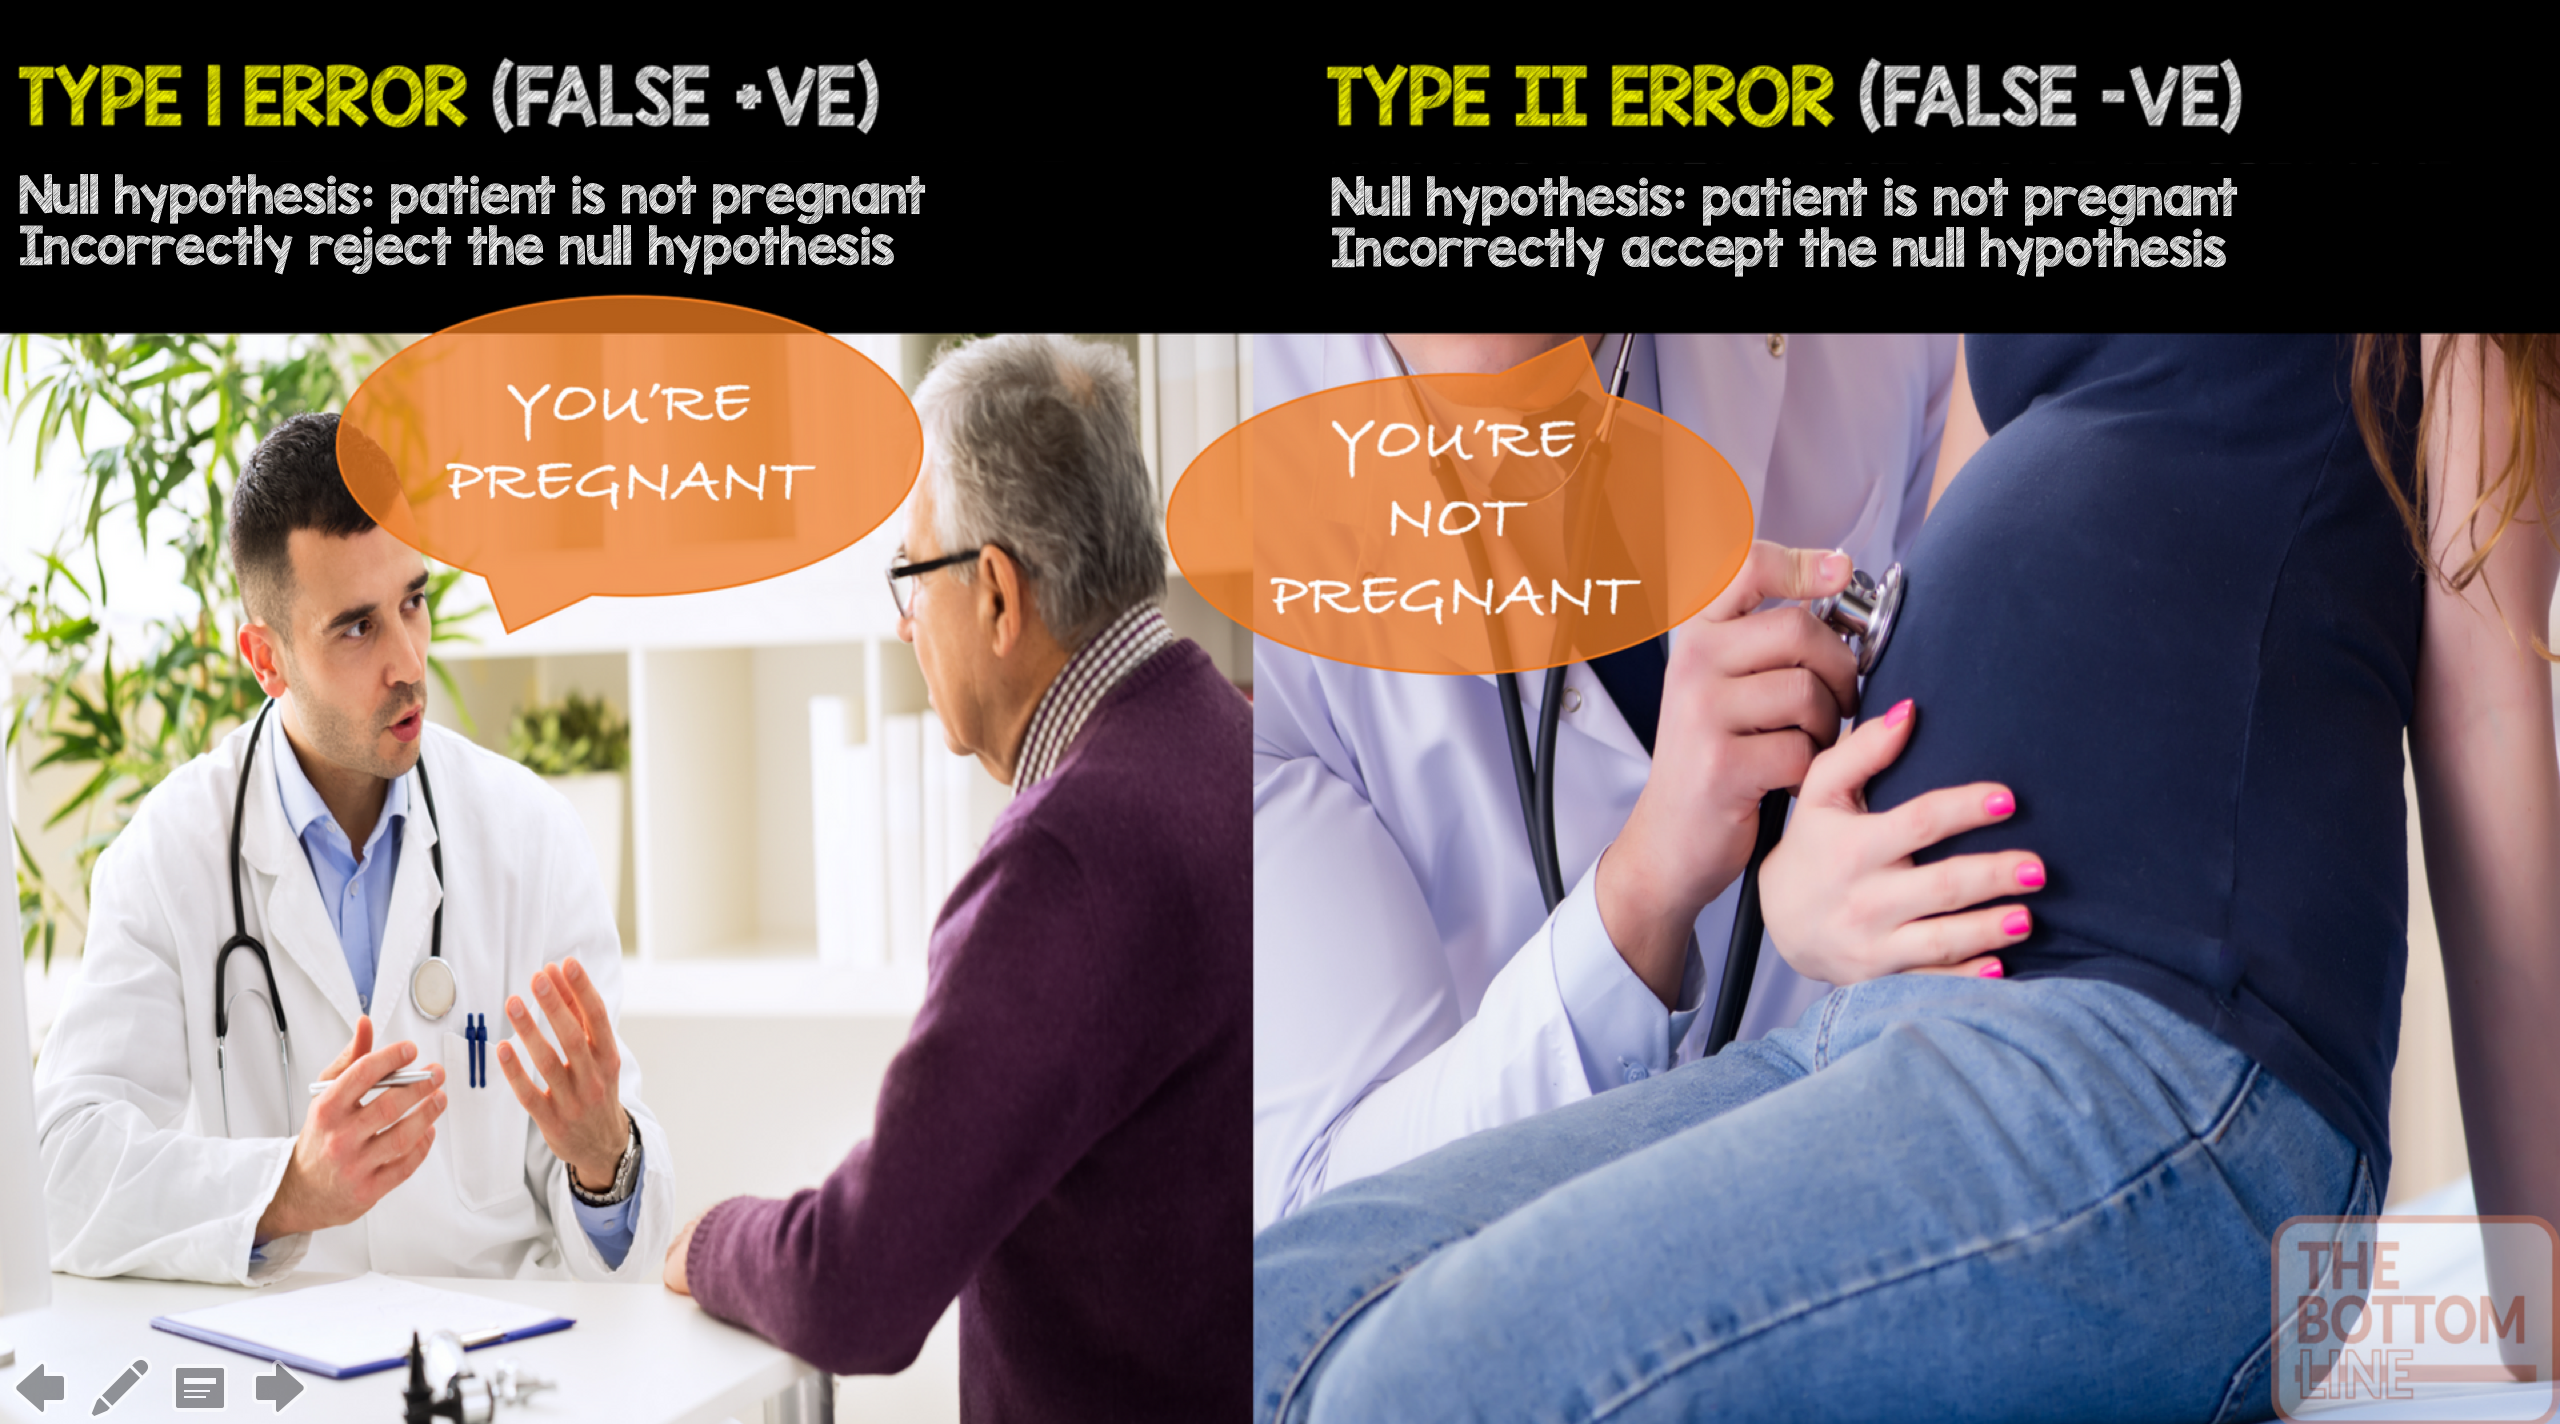
Type I error (false positive): Incorrectly rejecting null hypothesis e.g villagers believing the boy when there was no wolf
Type II Error (false negative): Incorrectly accepting the null hypothesis e.g villagers not believing the boy when there actually was a wolf
 An alternative way of remembering type I and type II errors is below
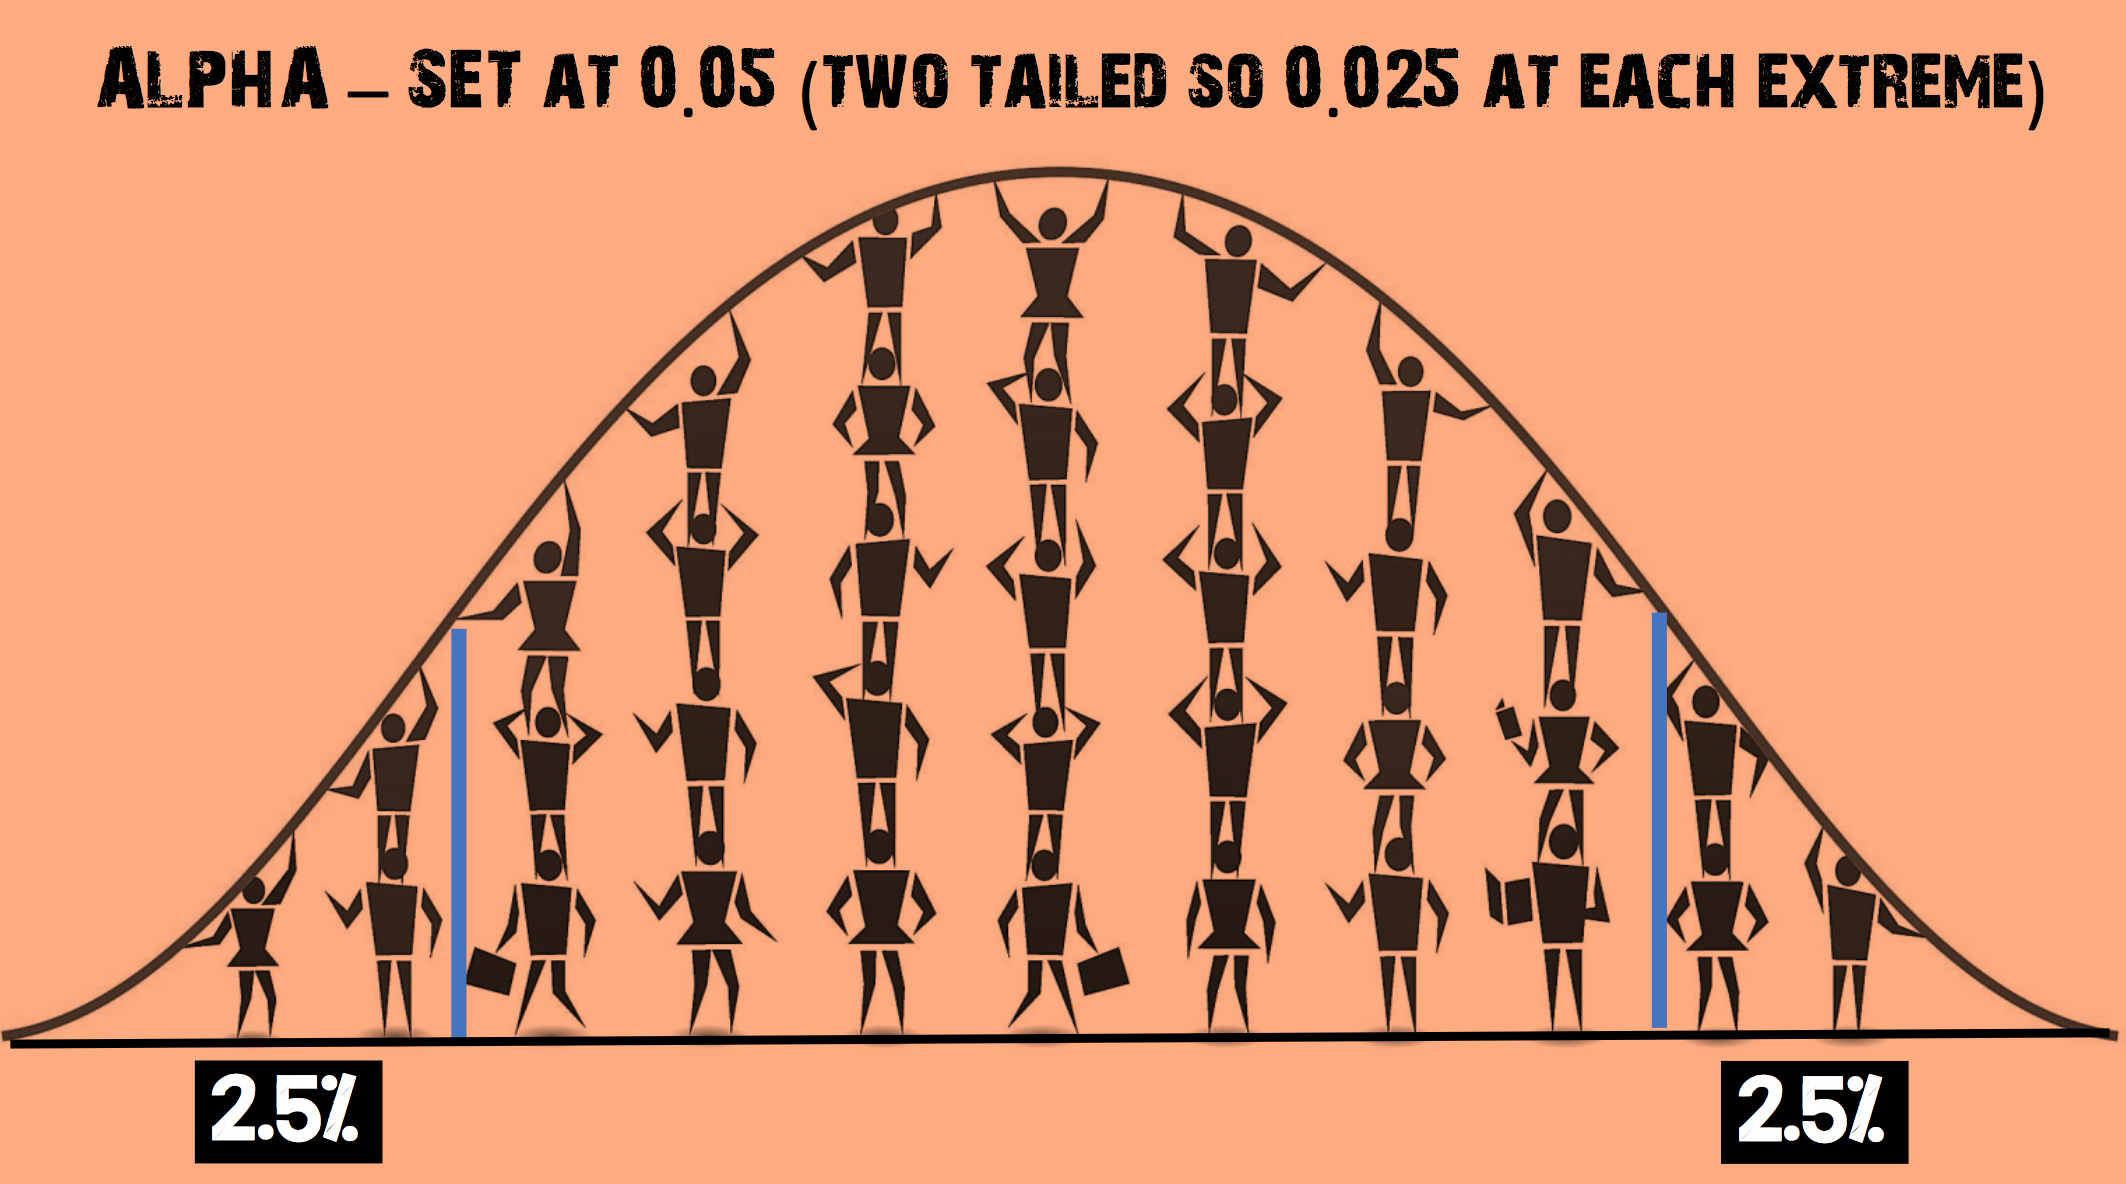
 Alpha: The probability of a type I error – finding a difference when a difference does not exist. Most medical literature uses an alpha cut-off of 5% (0.05), indicating a 5% chance that a significant difference is actually due to chance and is not a true difference. A tutorial on how to calculate the alpha level is here
Beta: The probability of a type II error – not detecting a difference when one actually exists. Beta is directly related to study power (Power = 1 – β). Most medical literature uses a beta cut-off of 20% (0.2), indicating a 20% chance that a significant difference is missed
1 - the power
Power: the pre-study probability that we correctly reject the null hypothesis when there really is a significant difference i.e we can detect a treatment effect if it is present
1 - the probability of a type II error
Power is influenced by the following factors:
1. The statistical significance criterion used in the test
- Commonly used criteria are probabilities of 0.05 (5%, 1 in 20), 0.01 (1%, 1 in 100), and 0.001 (0.1%, 1 in 1000). This set threshold is called the α level. By convention, the alpha (α) level is set to 0.05
- α = 1 – confidence level. If you want to be 95 percent confident that your analysis is correct, the α level would be 1 – 0.95 = 5 %
- If the criterion is 0.05, the probability of the data implying an effect at least as large as the observed effect when the null hypothesis is true must be 0.05 (or less), for the null hypothesis of no effect to be rejected
- One easy way to increase the power of a test is to carry out a less conservative test by using a larger significance criterion, for example 0.10 instead of 0.05. So why not just do this? More on this shortly
2. The magnitude of the effect (effect size) of interest in the population
- If the difference between two treatments is small, more patients will be required to detect a difference
- Effect size must be carefully considered when designing a study
- If constructed appropriately, a standardised effect size, along with the sample size, will completely determine the power
3. Population variance
- The higher the variance (standard deviation), the more patients are needed to demonstrate a difference
- This determines the amount of sampling error inherent in a test result
4. Baseline incidence: If an outcome occurs infrequently, many more patients are needed in order to detect a difference
Before a study is conducted, investigators need to decide how many subjects should be included. By enrolling too few subjects, a study may not have enough statistical power to detect a difference (type II error). Enrolling too many patients can be unnecessarily costly or time-consuming
Why is an α level of 0.05 chosen as a cut-off for statistical significance?
The α level of 0.05 is thought to represent the best balance to avoid excessive type I or type II errors
 (adapted from https://www.thoughtco.com/what-is-the-standard-normal-distribution-3126371 – accessed on 23.04.2017)
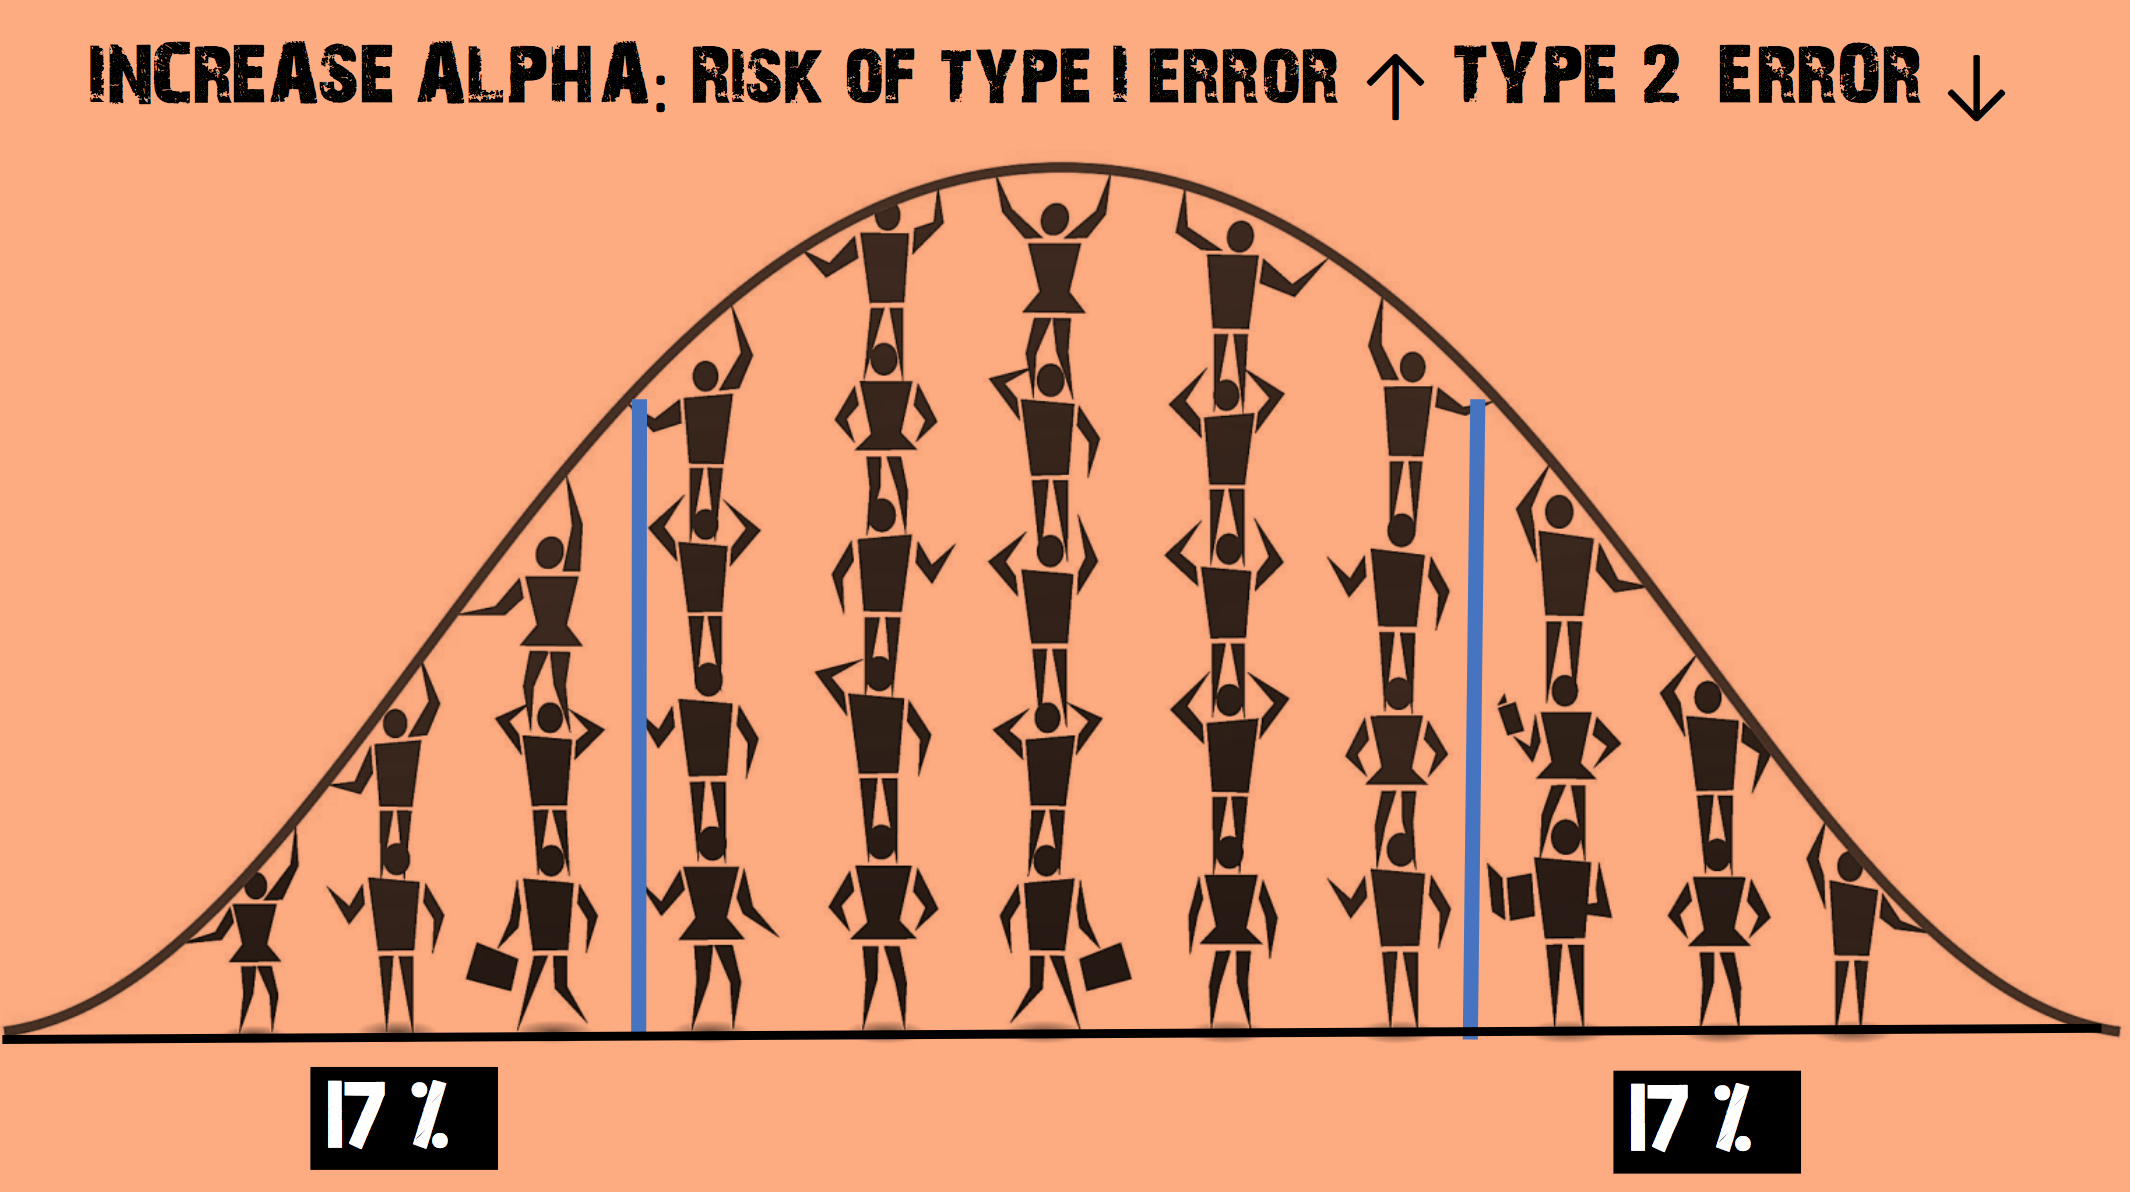
Imagine you decide to increase the α level so that it is now 0.35

- This increases the chance of rejecting the null hypothesis
- The risk of a Type II error (false negative) is REDUCED
- But the risk of a Type I error (false positive) is INCREASED
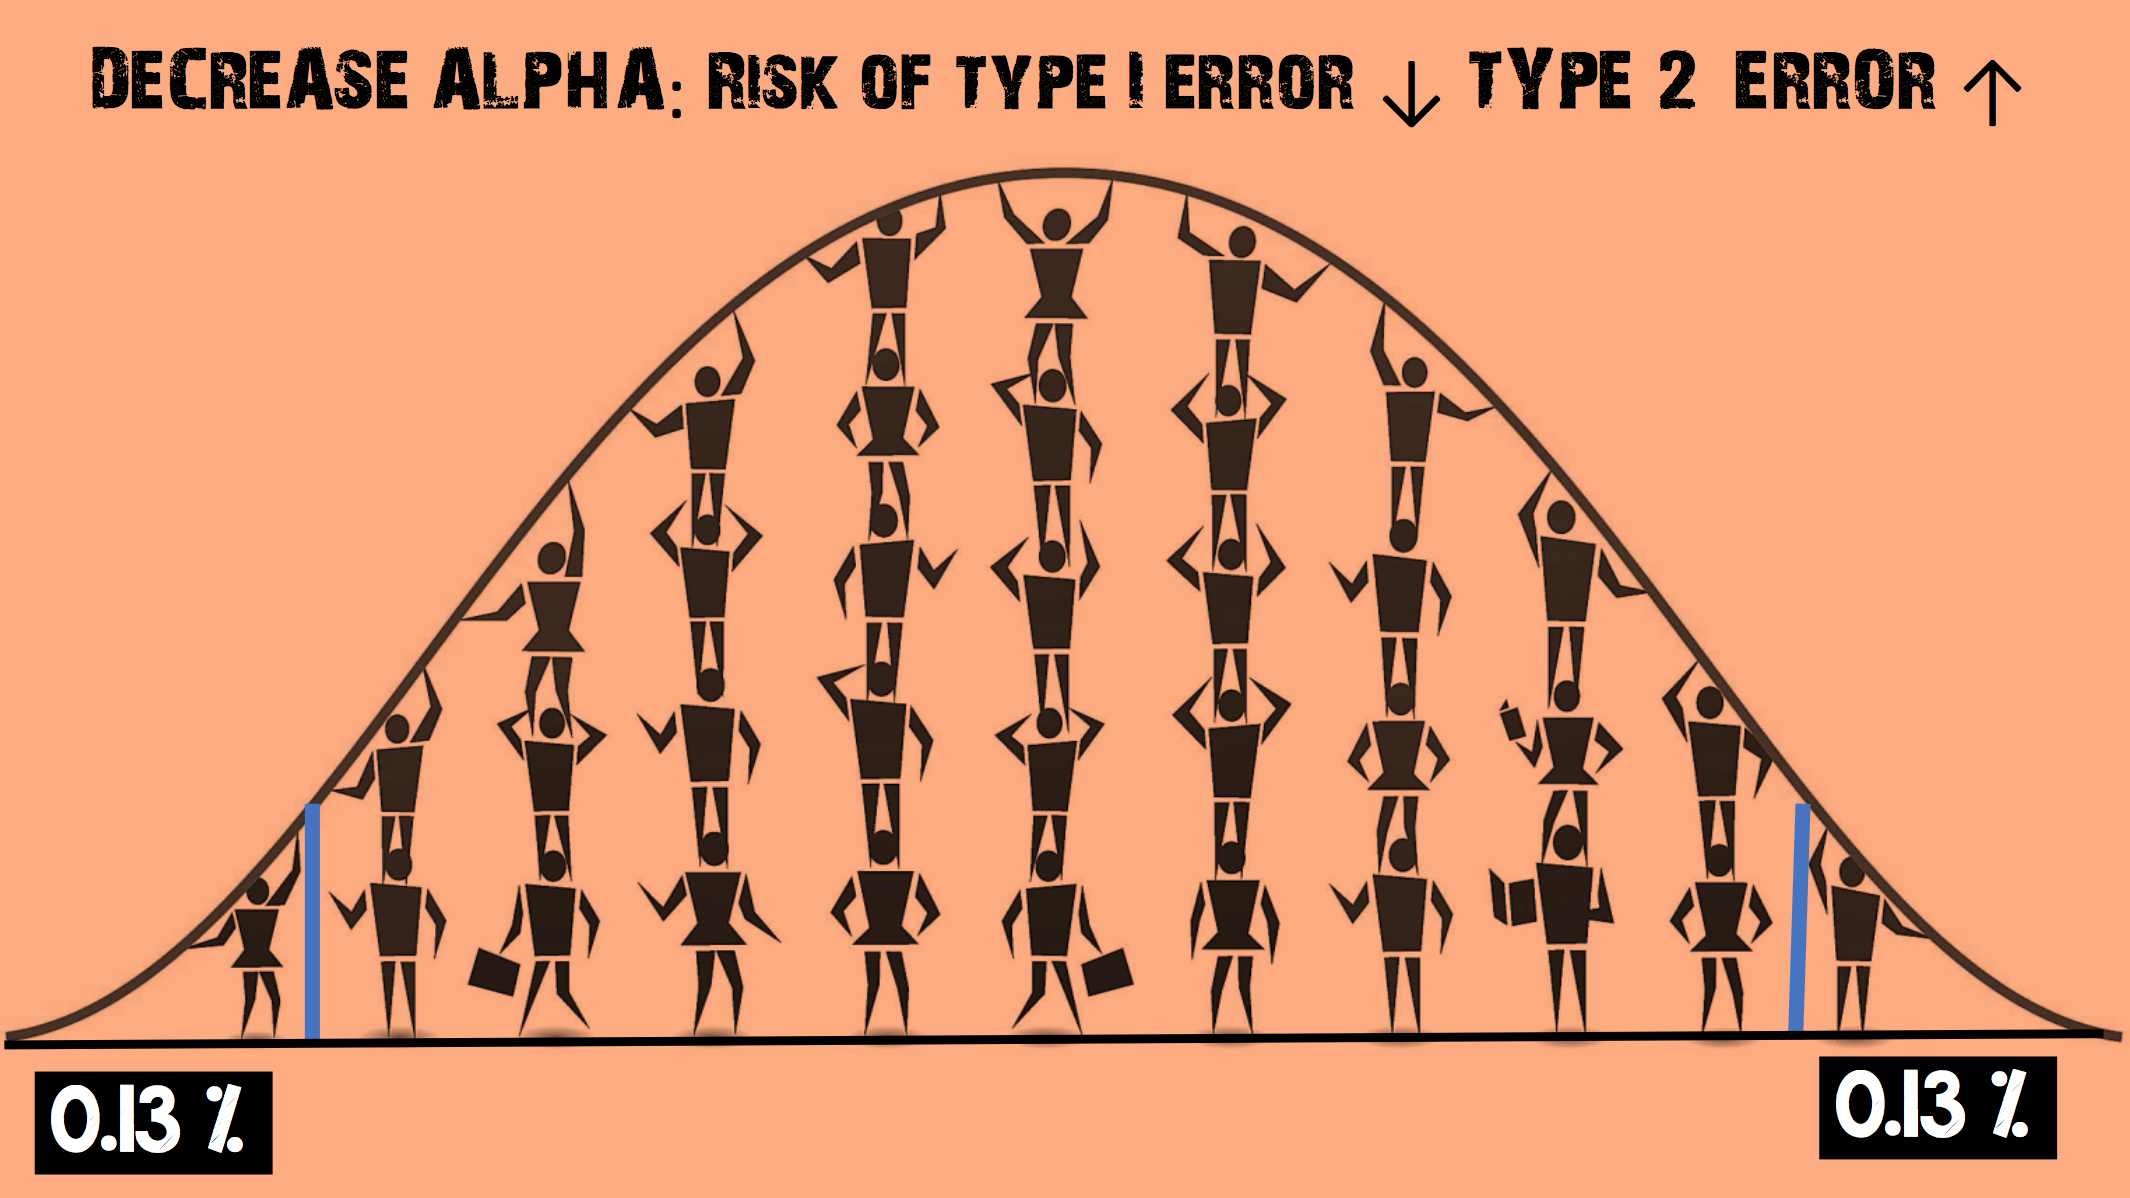
Imagine you decide to decrease the α level

- This increases the chance of accepting the null hypothesis
- The risk of a Type I error (false positive) is REDUCED
- But the risk of a Type II error (false negative) is INCREASED
The Bottom Line
- A type I error is the incorrect rejection of a true null hypothesis (a “false positive”), while a type II error is incorrectly retaining a false null hypothesis (a “false negative”)
- Power is the pre-study probability that we correctly reject the null hypothesis when there really is a significant difference i.e we can detect a treatment effect if it is present. It is influenced by statistical significance criterion, the magnitude of the effect, population variance and baseline incidence
- In statistical hypothesis testing, the more you try and avoid a Type I error (false positive), the more likely a Type II error (false negative) may happen. Researchers have found that an alpha level of 5% provides a good balance
External Links
- [videocast] Statistics 101: Visualising type 1 and type 2 errors
- [further reading] St.Emlyn’s Introduction to sample size calculations
- [further reading] ClinCalc Sample Size Calculator
Metadata
Summary author: Steve Mathieu
Summary date: 19th May 2017
Peer-review editor: Charlotte Summers


