Fragility Index

Definition of Fragility Index
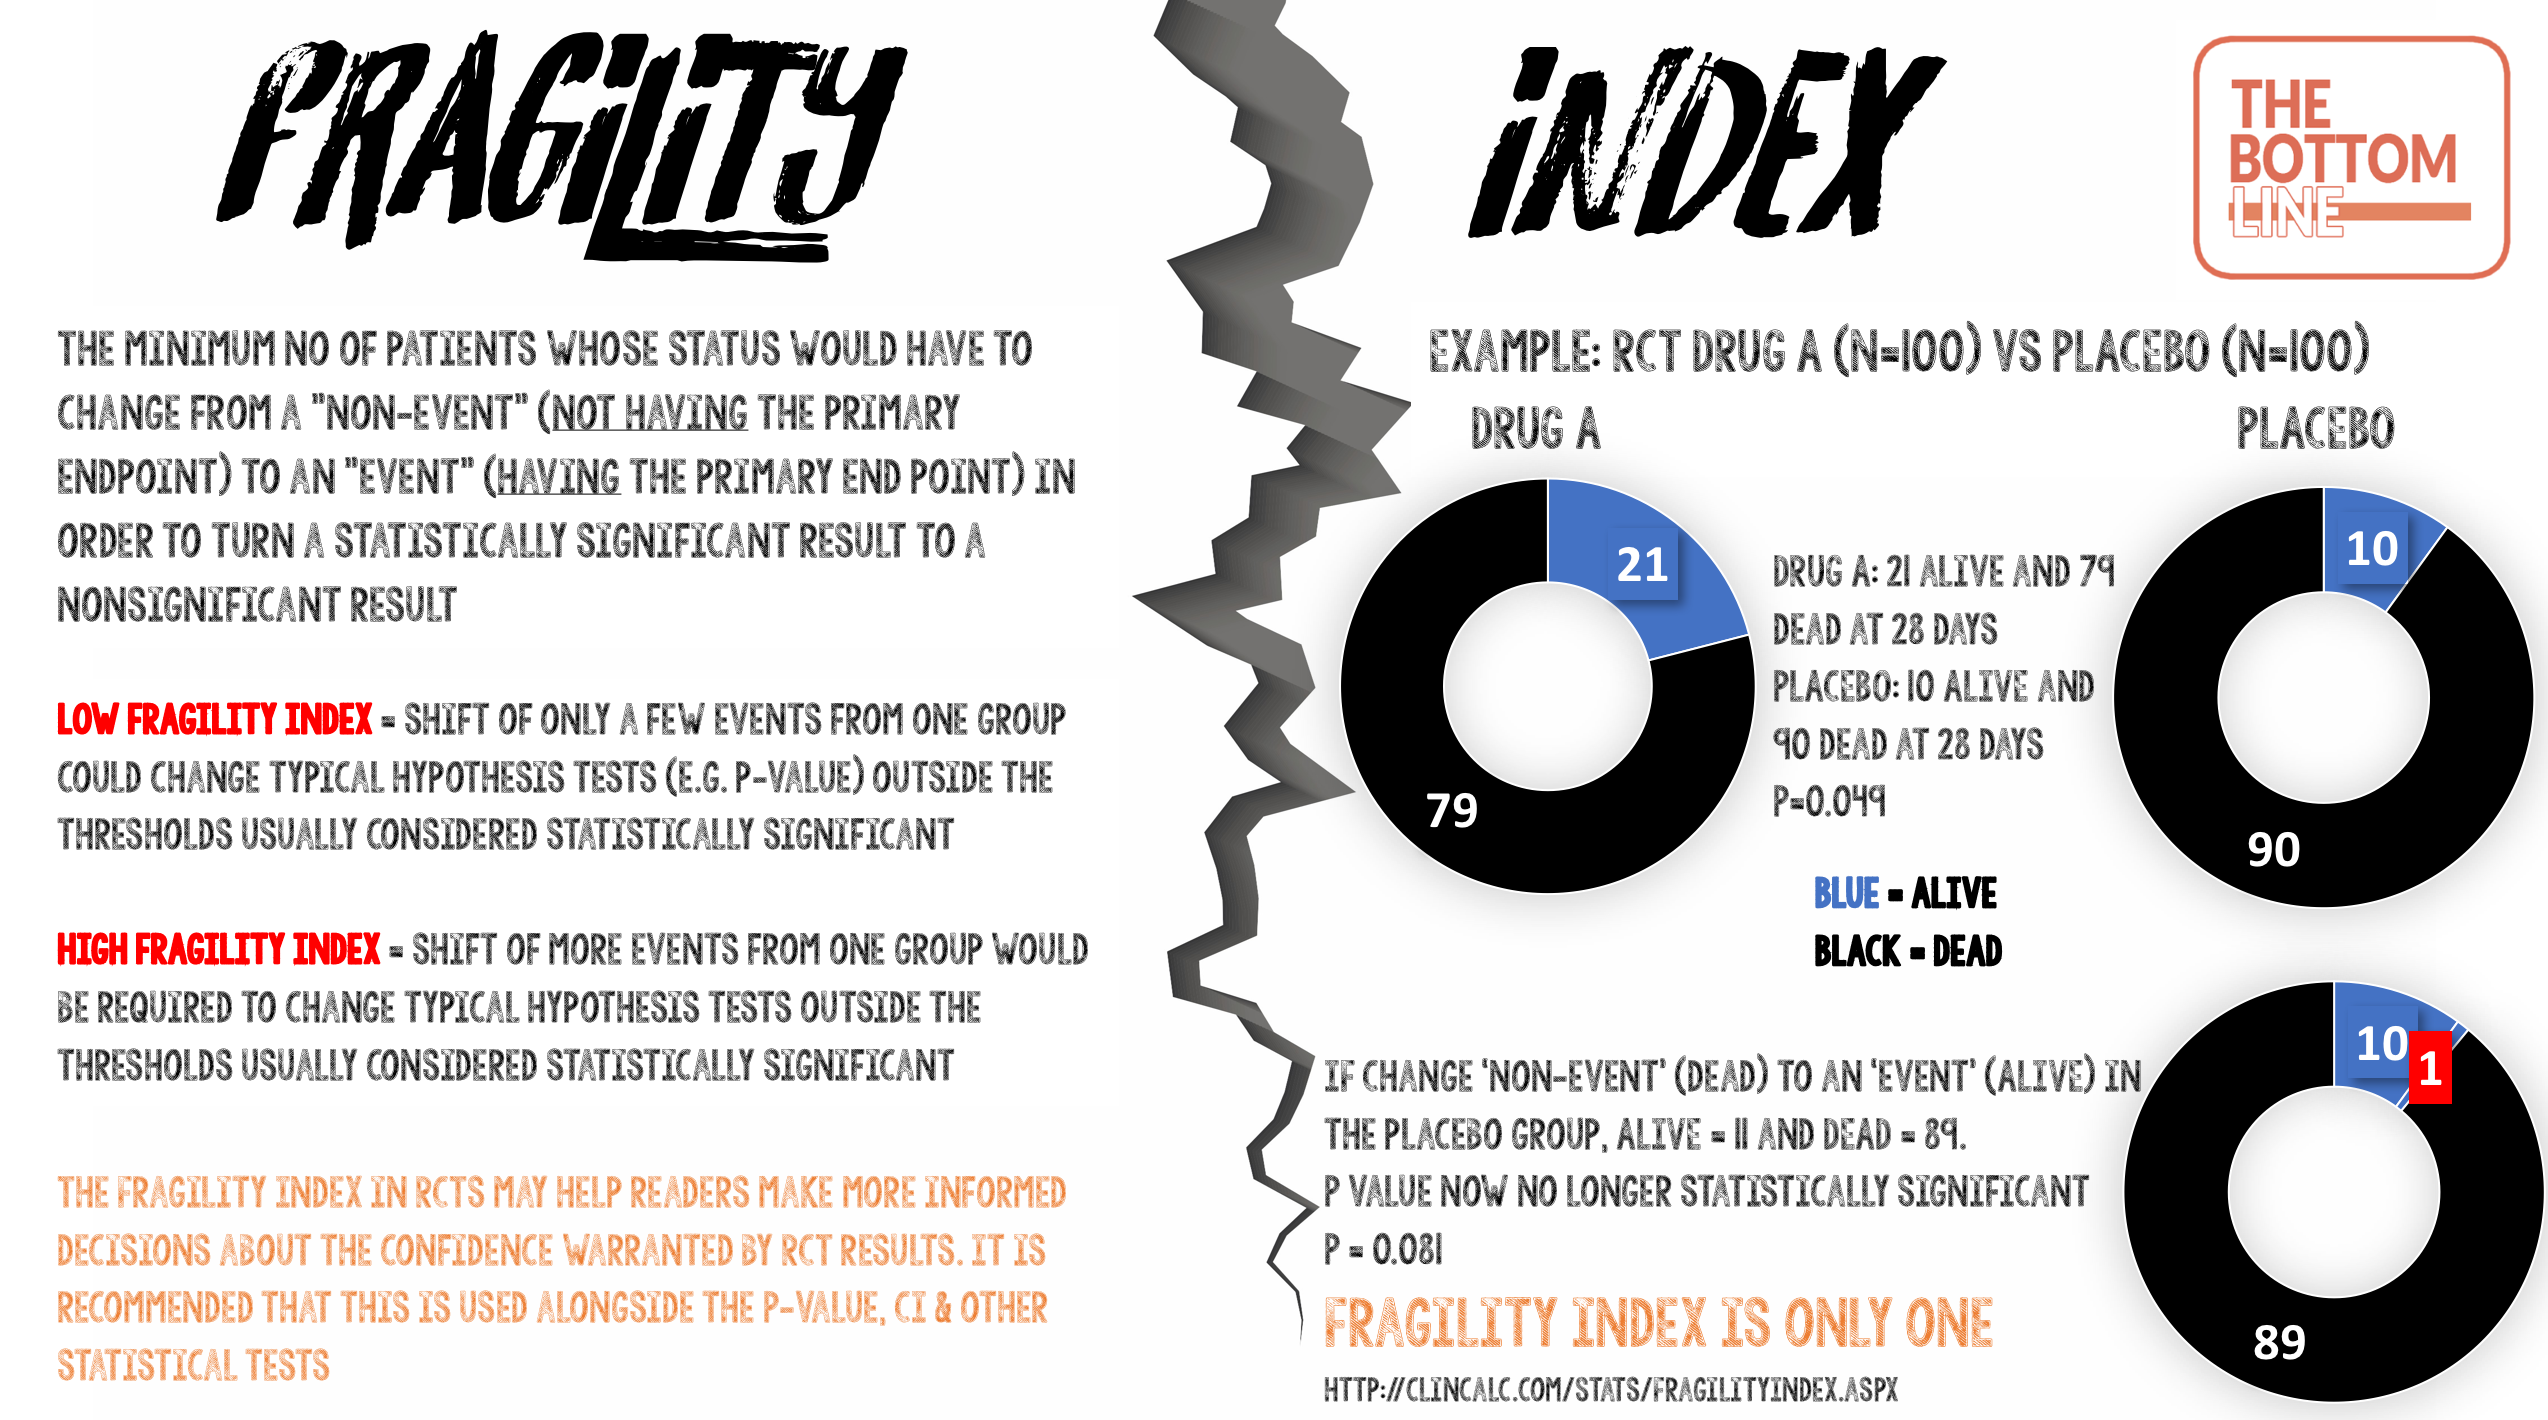
The minimum number of patients whose status would have to change from a “non-event” (not having the primary endpoint) to an “event” (having the primary end point) in order to turn a statistically significant result to a nonsignificant result.
What does that mean?
Fragility index measures the robustness (or fragility) of the results of a clinical trial. Imagine that a small study was performed with a p-value of 0.049 i.e. less than the threshold p-value of 0.05, so this is accepted as “statistically significant.” If only one patient experienced a different outcome, then the p-value may climb above 0.05. This study would then have a Fragility Index of one.
- Studies with a low Fragility Index mean that a shift of only a few events from one group could change typical hypothesis tests (e.g p-value) outside the thresholds usually considered statistically significant.
- Studies with a high Fragility Index mean that a shift of more events from one group would be required to change typical hypothesis tests outside the thresholds usually considered statistically significant.
Calculating the Fragility Index
There are really helpful open access resources with a Fragility Index calculator at ClinCalc and here.
The Fragility Index is calculated by converting one patient in the group (control or experimental group) from a “non-event” to an “event” outcome and recalculating a two-sided Fisher’s exact test until the P-value ≥ 0.05. You can do this easily using an on line calculator e.g Graphpad QuickCalcs.
An even easier way is to use the Fragility Index calculator available from ClinCalc.
The calculation describes how many patients would have needed to have a different outcome (within the group with the fewest number of events) to make a study’s results not statistically significant.
Example from ClinCalc
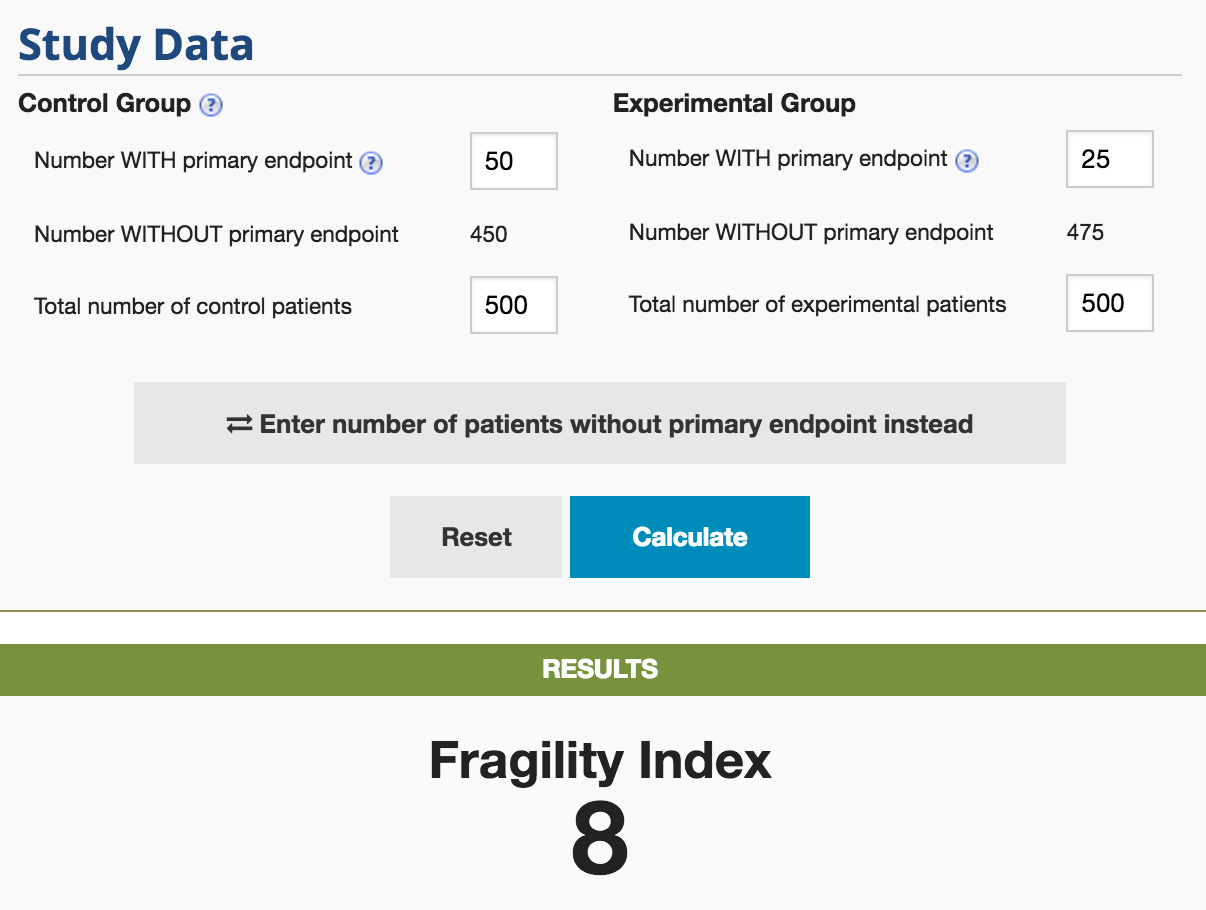
The P-value for this hypothetical study is 0.004. The Fragility Index for this is 8. By moving 8 patients in the experimental group from not having the primary endpoint to having the primary endpoint, the study would lose statistical significance (p = 0.06)
Some RCT’s with low Fragility Index
- CESAR – Fragility Index 2
- If 43 patients (rather than the 41 patients) in the control group compared with 57 patients in the ECMO group had survived to 6 months without physical disability, the P-value would have been >0.05
- PROTECT – Fragility Index 2
- If 26 patients (rather than the 24 patients) in the experimental group (receiving dalteparin) compared with 43 patients in the control group (unfractionated heparin) had experienced a pulmonary embolus, the P-value would have been >0.05
- A systematic review in 2016 identified 56 RCT’s reporting a statistically significant effect on mortality in critical care
- Median Fragility Index in these trials was 2 (IQR 1-3.5)
- 40% of trials had a Fragility Index of less than or equal to 1
- 12.5% of trials reported loss to follow-up greater than their fragility index
What is wrong with P-value?
- The magnitude of a P-value influences our confidence in trial results. However they have important limitations, which are often poorly understood
- Only one patient could make the difference between a P-value of 0.051 and 0.049. The latter, but not the former, is typically interpreted as indicating a more important treatment effect, despite there being minimal absolute difference between the two p-values
- A large study could have the same P-value as a very small study. Whilst both are regarded as “statistically significant”, the P-value does not provide any indication that there is a clear distinction between these studies leading one to conclude that the likelihood of a true effect is the same
- It is often assumed that the lower the P-value is below 0.05, the more statistically significant the result. This is too simplistic and can result in over emphasis on the clinical importance of the study
Fragility Index and loss to follow up
- If the number of patients lost to follow up is greater than the Fragility Index, the findings should be viewed with caution. If these data had been included it may have made the P-value change from statistically significant to be >0.05
Fragility Index of ‘0’
- If the statistical significance is so fragile that you do not even need to move a non-event to an event (in the control group), but just use a different statistical test to get a positive result, the study is extremely fragile
- A Fragility Index of ‘0’ will emphasise this lack of robustness of the trial data even though the P-value may be reported as <0.05
- Some examples include:
- If the P-value < 0.05 with a Chi-squared but 0.05 or more with a Fishers test, a Fragility Index of ‘0’ is assigned
- In laboratory science, it is not uncommon to repeat an experiment 6 or 8 times, then analyse the result using a Student’s t test, which assumes the data came from a normal (Gaussian) distribution. With a sample size of 6 or 8, it is impossible to tell if the population sampled is Gaussian or not. An alternative is to use non-parametric analyses (e.g Mann Whitney U) which doesn’t assume the sampled population is normally distributed, but has less statistical power. It is not uncommon to see a statistical difference in data analysed using a t test, that is not present when using Mann-Whitney. The Fragility Index is therefore ‘0’
Limitations of Fragility Index
- Only appropriate for RCT’s and for dichotomous (binary) outcomes
- Fortunately, many important outcomes are naturally dichotomous (e.g alive/dead, myocardial infarction/no myocardial infarction)
- Even ordinal categorical outcomes are frequently presented as dichotomies to aid interpretation e.g modified Rankin scores presented as ‘good’ and ‘bad’
- No specific cut off value to determine at what point a study no longer is regarded as ‘robust’
- Not appropriate for time-to-event outcomes
- Although many time-to-event outcomes are usually dichotomous (e.g mortality), the fragility index does not account for the difference in outcome over time
The Bottom Line
- Fragility Index is the minimum number of patients whose status would have to change from a “non-event” (not having the primary endpoint) to an “event” (having the primary end point) in order to turn a statistically significant result to a nonsignificant result
- It is a simple metric to calculate and use
- Reporting the Fragility Index in RCTs may help readers make more informed decisions about the confidence warranted by RCT results
Infographic
External Links
- [article] The Fragility Index in Multicenter Randomized Controlled Critical Care Trials
- [article] The statistical significance of randomized controlled trial results is frequently fragile: a case for a Fragility Index
- [Open access resource] GraphPad QuickCalc
- [Open access resource] Fragility Index Calculator from ClinCalc
- [further reading] Fragility Index LITFL
- [further reading] PulmCrit: What is the fragility index of the NINDS trial?
Metadata
Summary author: Steve Mathieu
Summary date: 27th April 2017
Peer-review editor: Charlotte Summers


Pingback: WOMAN Trial – The Bottom Line
Pingback: P-Value – The Bottom Line
Pingback: HYPERION – The Bottom Line
Fragility index explanation very helpful!
I believe that fragility index can be used only for the trials showing “statistical significance”. Any similar tool to assess trials reporting “no significant difference” in the binary primary outcome?