Power and Sample Size

In this Editorial, Professor Imelda Galvin from Queen’s University in Canada takes us through the details of Power, how it relates to trial sample size, and why it matters.
Definitions
Working definition of Power
Probability that the trial will detect a true difference in the outcome of interest between the treatments being assessed.
Since power is a probability is can range from 0-1
Statistical Definition of Power
Probability that the hypothesis test correctly rejects the null hypothesis when the alternative hypothesis is true.
Null Hypothesis
There is no real difference between the treatments being assessed and any difference observed is purely due to chance.
The null hypothesis is denoted by H0
Alternative Hypothesis
There is a true difference between the treatments being assessed.
The alternative hypothesis is denoted by H1
Type I Error – False positive
Risk of detecting a statistically significant difference when one does not actually exist.
The risk of rejecting the null hypothesis when the null hypothesis is actually true.
Type II Error –False negative
Risk of failing to detect a statistically significant difference when one actually exist.
The risk of accepting the null hypothesis when the null hypothesis is not actually true.
Alpha α
Probability of a type 1 error.
It is usually set at 0.05, meaning we accept a 5% risk of detecting a statistically significant difference when one does not actually exist.
Beta β
Probability of a type II error.
It is usually set at 0.20, meaning we accept a 20% risk of failing to detect a statistically significance difference when one actually exists.
Effect Size
Magnitude of the difference in the outcome of interest between the treatments being assessed.
Factors Affecting Sample Size
- Size of the difference you want to detect – The smaller the size of the difference in the outcome of interest you want to detect, the larger the number of participants who will need to compare.
- The expected event rate in the control group and the treatment group.
- Accepted probability of a type I error – α
- Accepted probability of a type II error – β
- Power – the higher the degree of certainty we require that the result we observe is a true result, then the greater the number of participants needed. Power =100- β, so if we want a power of 90% then we want a β of 10% (i.e. 10% risk of a type II error). The higher the power, the more participants we need.
- Study design – Different trial designs require different sample sizes, For example a parallel arm RCT requires more participants than a before and after study. The ratio of intervention assignment also matters, if it greater than 1:1 then more participants are needed.
- Loss to follow up – Sample size should be adjusted to account for anticipated loss to follow up.
The Problem with Underpowered Studies
Low positive predictive value
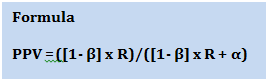
The positive predictive value (PPV) is the probability that your finding is a true effect. It depends on
- Power =1- β
- Pre study odds of the observed effect being a true effect
- Type I error = α
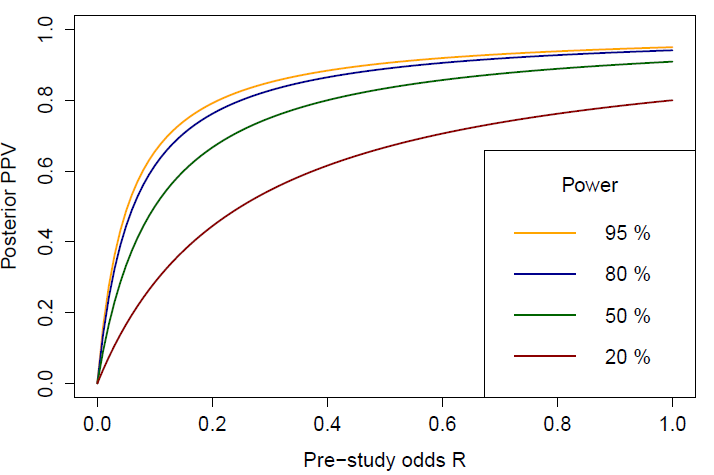
The lower the power of a study, the weaker is the association between PPV and pre study odds ratio. The effect is greatest when the pre study odds are low.
Greater risk of a Type 1 error – False Positive
Winner Curse
The smaller the effect, the larger the sample size required to detect it. Small studies are generally only able to detect large effects, they are not good at detecting medium or small effects.
All three magnitudes of effect can occur by chance without being a true effect. In a large study, there is an equal probability of all three being detected and so an equal probability of under and over estimation of effect.
In a small study, there is a greater probability of only detecting the large effect. If one or more of these random large effects cross the threshold for significance, then the study may incorrectly assume a significant result. Small studies are essentially biased towards detecting random large effects.
Vibration Effects
All studies are subject to small changes in study conduct and minor deviations from protocol. In larger studies the effects of these alterations tend to get diluted out more than in smaller studies. For example – excluding 5 participants from analysis because they had incomplete data sets would have a much greater effect on study results in a study of 50 participants than it would in a study of 500 participants. This makes rigorous protocol adherence even more important for small studies. Unfortunately these are often the studies in which protocol deviation is more likely as under powering is often a feature of under appreciation of the need for robust study methodology.
Greater risk of a Type II error- False negative
A power of 50% means that that there is 50% risk of a false negative result, a power of 80%, means there is 20% risk of a false negative result.
Greater risk of hindering future research
False negative results may deter researchers from investigating the treatment in future as they falsely assume it was proven to be ineffective.
False or exaggerated positive results may result in inaccurate sample size calculations for future studies as sample size calculations require researchers to calculate the expected event rate in the treatment group, which they obtain from recent similar studies.
If that event rate is based on false or exaggerated results, then the sample size calculation it is based on will be inaccurate. For example if a small study reported a 10% reduction in mortality when the real but unknown reduction was only 2%, the sample size for the next study would be less than required to show a 2% difference in mortality as it would be powered on the basis of the reported 10% difference and so that study would also end up underpowered.
Ethical issues
Smaller studies could be regarded as a waste of participant’s time and funding resources and of hindering future research in that area.
The Bottom Line
- Power is the ability of a study to detect a true difference in the outcome of interest
- An adequately powered study requires an adequate sample size
- Several factors need to be taken into account when calculating sample size
- The smaller the difference you want to detect, the lower the event rates in the groups being compared, the more certain you want to be that the result you get is in fact a true result, then the more participants you need
- Underpowered studies are prone to false negative and false positive results and may hinder future research in that area
References
- Wang D, Bakhai A. Clinical Trials. A Practical Guide to Design, Analysis and Reporting.Remedica 2007. Chapter 9
- Kirkwood BR, Sterne AC. Medical Statistics. Second Edition. Blackwell Science. Chapter 35
- Button KS, Lonnidis JPA, Morkrysz C, Nosek BA, Flint Robinson ESJ Munafò MR, Power failure: why small sample size undermines the reliability of neuroscience. Nature Reviews Neuroscience 2013:14:355-76
Is sample size calculation relevant for observational cohort studies
Probably not, in my opinion. Sample size calculations can assist if there is an intention to take descriptive biostatistics to inferential biostatistics. A trial should be designed with sufficient size to deliver meaningful inference.
However, I must declare I’m a clinician with an interest in stats and EBM. I’m not a statistician!